ARCHIVED PAGE
This page is no longer maintained with updates but remains available for reference purposes.
Solid Waste Management


Waste Tracker Dashboard
Current and Future Estimated Waste Diversion Rates for Boone & Winnebago County
These estimates are the result of modeling from technical support provided by Dr. Ai. For more information on this modelling, please see Appendix E: Public Survey, Comments & Data Methodology.
Commercial, Industrial & Institutional Waste – Waste generated from entities such as restaurants, factories, and schools. Residential Waste – Waste generated from households.
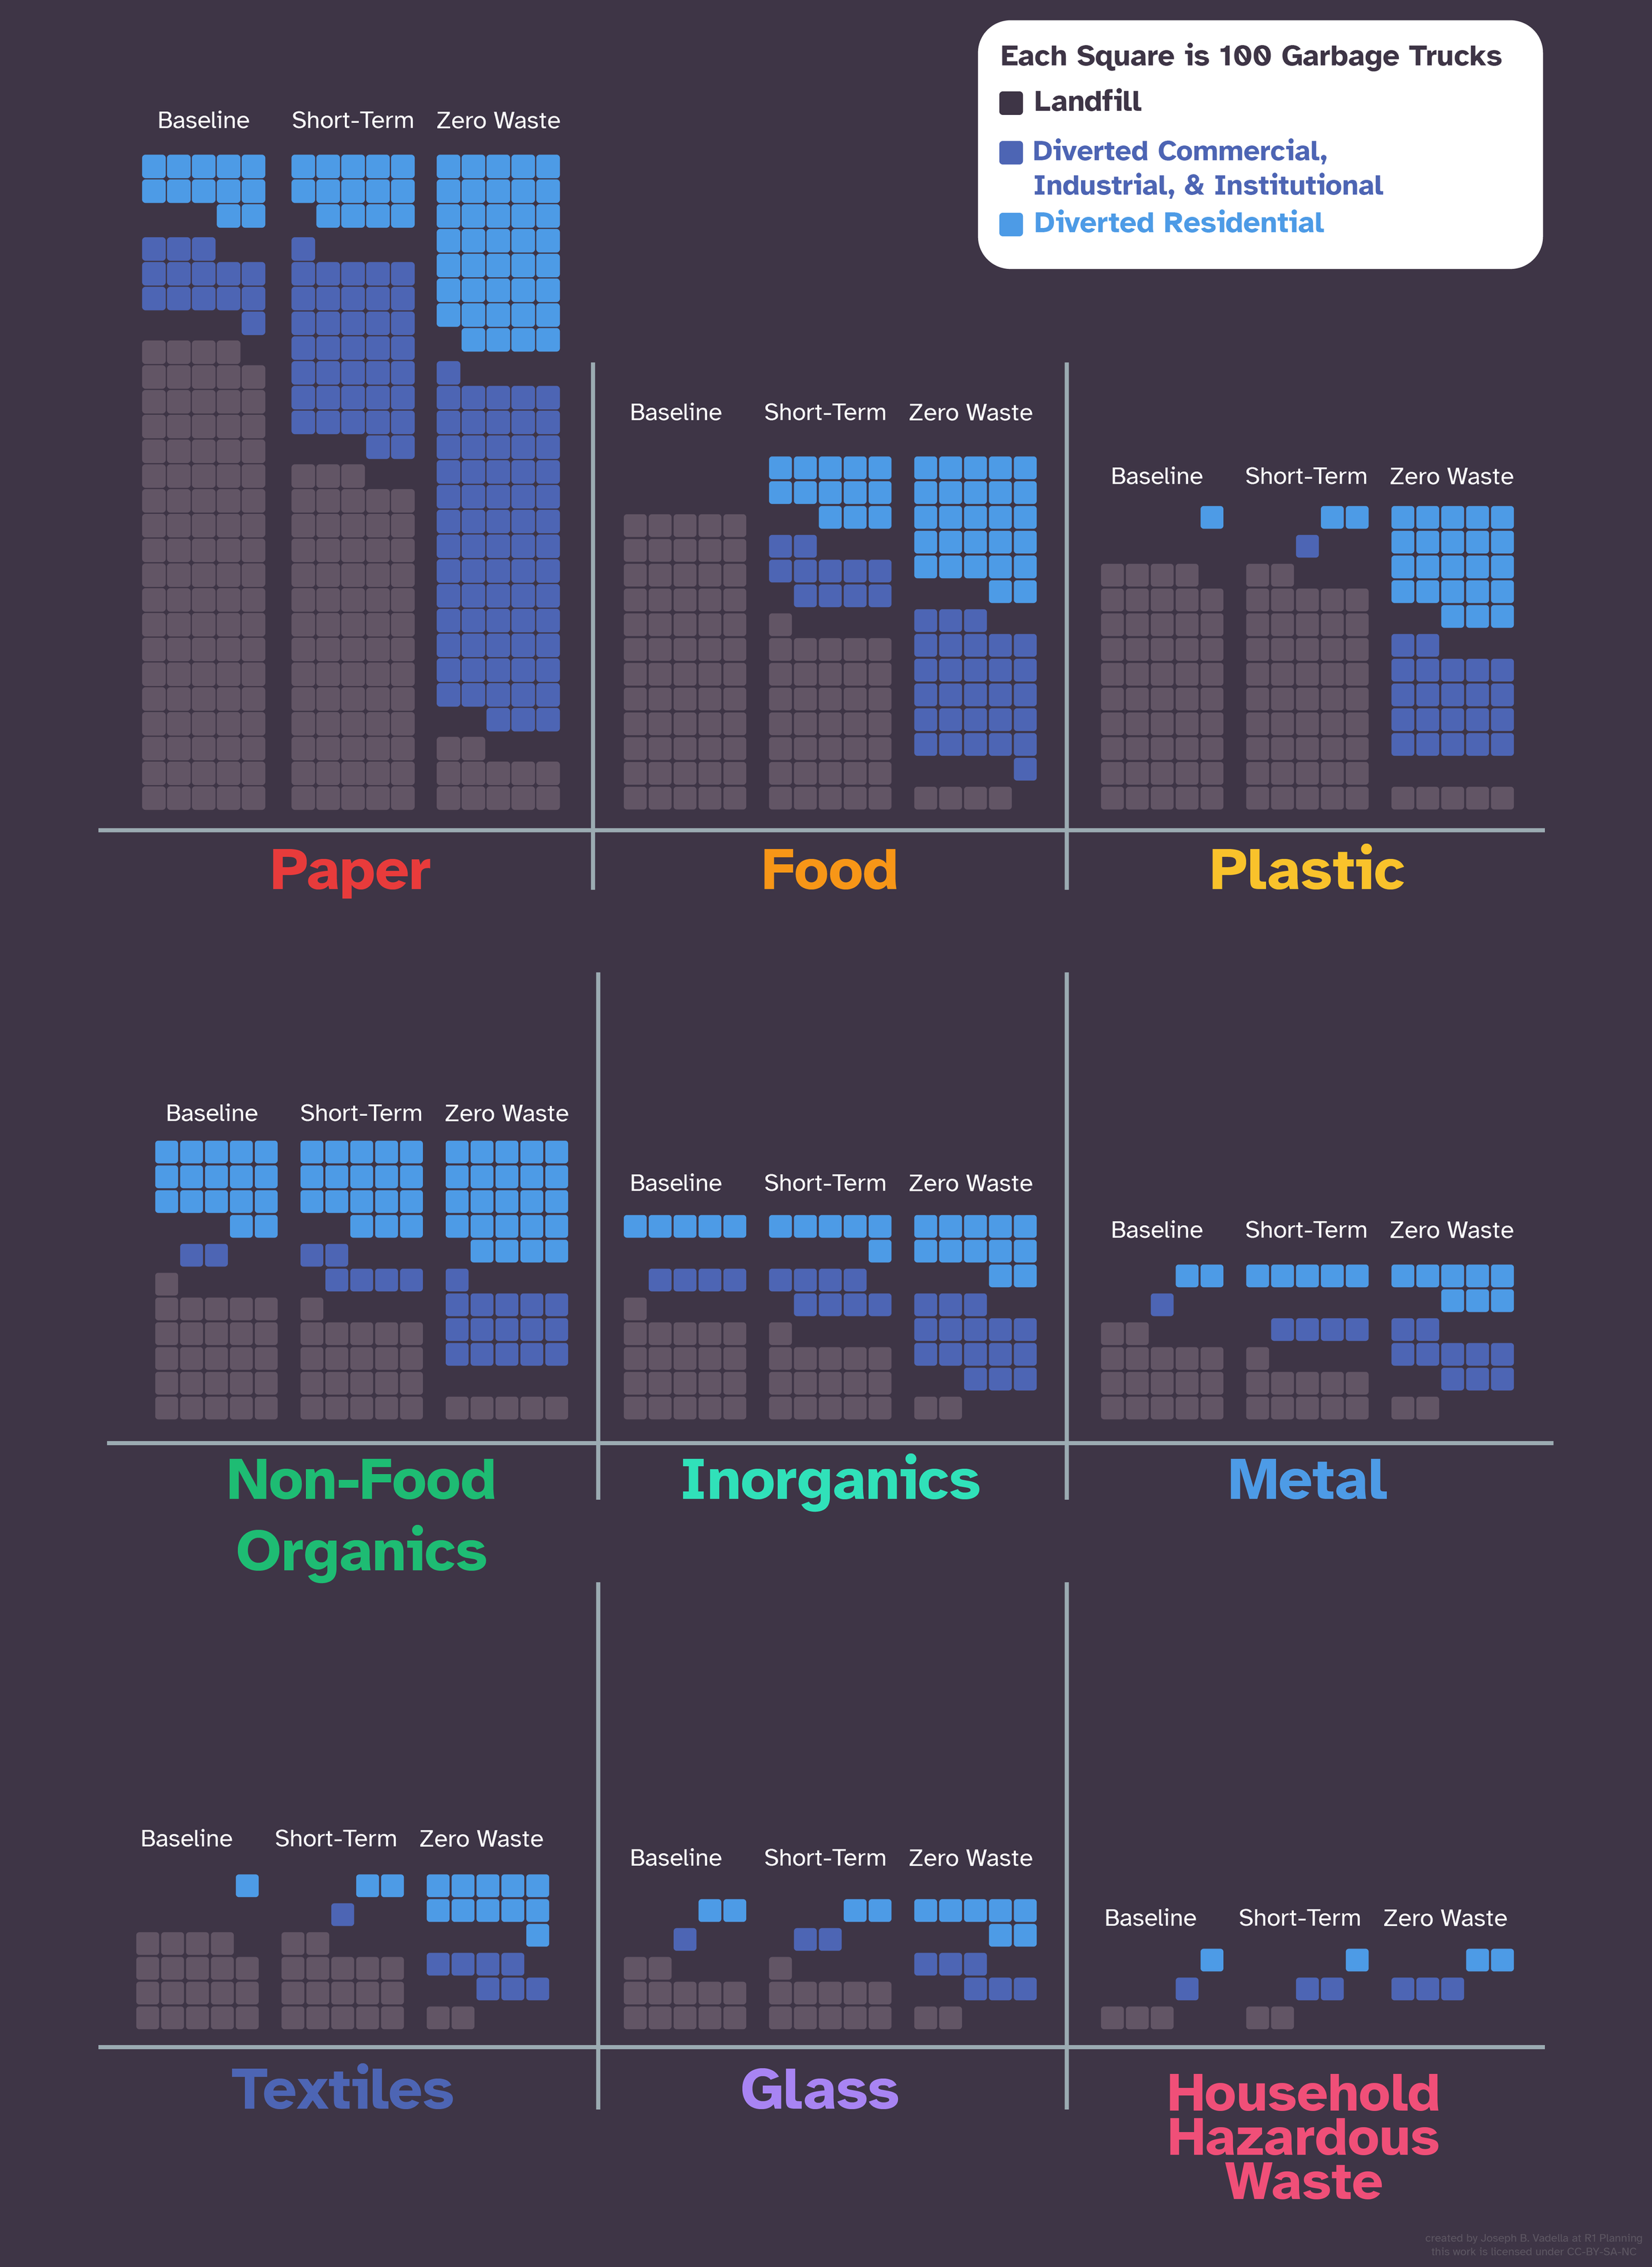
The Baseline column shows 2019 projections, the Short-Term column shows 3-5 year projections (2024-2026), and the Zero Waste column is a long-term goal for zero waste (2050).
The average garbage truck holds around 10 tons of waste and each square represents 100 full garbage trucks worth of waste. Grey squares are truckloads which end up in the landfill; dark blue squares are truckloads of waste from commercial, industrial and institutional sources; and light blue are truckloads from residential waste.
Beverage containers are excluded in this visualization, as they represent an insignificant portion of the waste generated. Please review Chapter 4: Waste Generation Assessment of the Regional Solid Waste Management Plan for Boone & Winnebago Counties (2022 – 2042).
Winnebago County Waste Generation Volumes by Material (2019)

How much waste does Winnebago County create? This chart shows the breakdown by type of waste and where it was created.
Each square represents 100 full garbage trucks worth of waste. The biggest category by far for both residential and nonresidential waste is paper products. The smallest is Household Hazardous Waste.
Boone County Waste Generation Volumes by Material (2019)

How much waste does Boone County create? This chart shows the breakdown by type of waste and where it was created.
Each square represents 100 full garbage trucks worth of waste. The biggest category for both residential and nonresidential waste is paper products. The smallest is textiles and Household Hazardous Waste.
Predicted Annual Waste Generation by Weight With Current Practices
Winnebago County
(2000-2040)

Boone County
(2000-2040)

Waste estimates here include “municipal” waste from Residential, Commercial, Industrial, and Institutional sectors; construction and demolition (C&D) waste is excluded. The dots show historic reference data. CI stands for confidence interval. These charts were created by the UIC team lead by Dr. Ai. Please note that this information does not take waste disposal with origins outside the two Counties. This only accounts for generation within Boone and Winnebago.